

 Facebook
 X
X
 Pinterest
 Copy Link
Our Favorite Local Pumpkin Patches – 2026

Grab your flannel…fall is coming in for a landing, and pumpkin patches around the Sound are getting ready to throw open their gates! From peaceful roadside farms to full-blown autumn playgrounds with corn mazes, zip lines, and activities galore, here are our favorite local haunts where you can soak up the season. Most run every weekend through October (a few start this weekend!), and several are happy to have your leashed pup tag along. Bonus: after dark, some of the farms and corn mazes become haunted…or overrun by zombies with paintball guns. Scroll down for the lowdown on each patch!
Eastside | North of Seattle | South of Seattle
Eastside
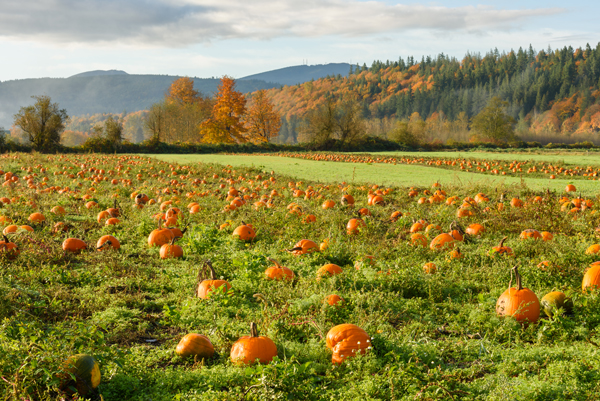
Fletcher Farm
Leashed dogs encouraged! Scavenger hunt, farm animal zoo, storybook trail, mini-golf, photo stations, and junior corn maze for the little ones.
Open Sat & Sun, 11a-6p | 9/26-10/31
18712 SE May Valley Road | Issaquah
fletcherfarmevents@gmail.com
fletcherfarmissaquah.com
JB Pumpkin Farm & Puzzle Patch
Snap beautiful photos in the Sunflower Walk, get lost in the giant corn maze, or choose from a colorful variety of pumpkins & gourds. Bring your pet!
Open Thurs, 2-7p & Fri-Sun, 9a-7p | 9/19-10-31
14063 NE 145th Street | Woodinville
(425) 380-1515
jbfamilygrowers.com
Jubilee Farm
Weekend hay rides, food trucks, animals, barn store, & hot apple cider.
Sat & Sun, 10a-5p | Every weekend in October
(Basic u-pick also open M-F, 10am-5pm)
229 W Snoqualmie River Rd NE | Carnation
jubileefarm@hotmail.com
jubileefarm.org
McMurtrey Farm
Wagon rides, a corn field hunt, photo boards, duck races, games, kettle corn, face painting, and more. Leashed pets welcome!
Open Wed-Sun, 10a-6p | 9/23-10/31
13925 Redmond-Woodinville Rd. NE | Redmond
(425) 482-6795
mcmurtreyfarm.com/pumpkin-patch
Novelty Hill Farm
Dog-friendly! Corn maze, farm critters, trike track, hay mow, & picnic/fire pit rentals.
Open Fridays, 3-6p & Sat/Sun, 10a-5p | 10/2-10/31
(Self-serve pumpkin patch & corn maze also open daily)
26617 NE 124th Street | Duvall
(425) 788-2416
noveltyhillfarm.com
Oxbow Farm & Conservation Center
Apple trebuchet competition, food, hay house, clue hunt, hay rides, mini pumpkin painting, living playground, & more.
10/17, 10/18, 10/24, & 10/25 | 10a-4p
10819 Carnation-Duvall Rd. NE | Carnation
(425) 788-1134
oxbow.org/oxtober
Remlinger Farms
25 rides & attractions for children (including a train, carousel, & mini roller-coaster!), pony rides, arcade, corn maze, apple cannon, cafe, & brewery with 20 choices on tap.
Open Fri, Sat & Sun, 10a-6p | 9/26-11/1
(Quieter self-guided tours by reservation on Thursdays, Oct 1, 8, 15, 22 & 29, 10a-3p)
32610 NE 32nd Street | Carnation, WA
(425) 333-4135
remlingerfarms.com
North of Seattle
Bob’s Corn & Pumpkin Farm
12-acre corn maze, 2 kids’ mazes, play barn, hay rides, trike track, & apple cannon. Fire pit rentals for private groups, too!
Open Daily, 10a-7p (Last entry @5p) | 9/19-11/1
Night Maze: Fridays & Saturdays, 5:30-11p (Last entry @9:30p)
10917 Elliott Road | Snohomish
(360) 668-2506
bobscorn.com/fall-activities
Carleton Farm
Corn maze, play area, jump pad, paintball shooting gallery, apple cannons, hay rides, & kids’ bucket train.
Full Activities on Saturdays, 10a-6p & Sun, 10a-5p | Weekends in October
630 Sunnyside Blvd SE | Lake Stevens, WA
(425) 343-4963
carletonfarm.com
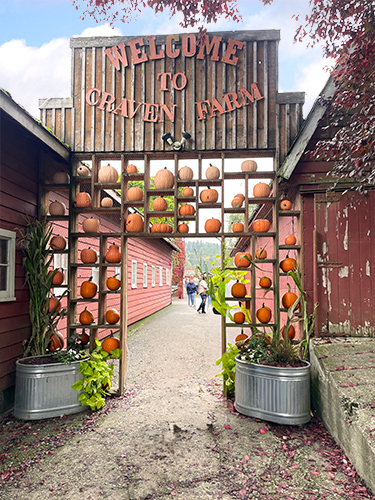
Craven Farm
15-acre corn maze, kids maze, jump pad, farm animals, mini golf, cow train, foosball, apple cannon, espresso, cider donuts, & paintball gallery. Fire pit rentals, and special dog-friendly days, too! New this year: a Hay-ground play area.
Open Wed-Sun, 10a-6p | 9/19-11/1
13817 Short School Road | Snohomish
hello@cravenfarm.com
cravenfarm.com/fall-festival
Fairbank Animal & Pumpkin Farm
Lots of baby animals, corn “maize maze,” tiny tot hay tunnel, toy duck races, photo boards, & veggie garden.
Open 10a-5p | Every weekend in October
15308 52nd Ave W | Edmonds
(425) 743-3694
fairbankfarm.com
Stocker Farms
30+ attractions including a mega slide, giant jumping pillow, tire mountain, epic play area, zip line, corn maze, pumpkin cannon, & more. The farm’s evil twin, Stalker Farms, comes out at night.
Open Weekends 9/19-20 & 9/26-27, then Daily 10/1-10/31 | 10a-6p (Last entry @5p)
8705 Marsh Rd | Snohomish
(360) 568-7391
stockerfarms.com
Swans Trail Farms
Washington State corn maze, kids corn maze, petting farm, wagon rides, big slides, zip lines, u-pick apple orchard & live duck races.
Open Daily 10a-6p | 9/12-10/31
“Great Harvest Glow” on weekends from 5-9:30p (Fri-Sun in Sept, Thurs-Sun in Oct)
7301 Rivershore Rd | Snohomish
(425) 330-3084
swanstrailfarms.com
Thomas Family Farm
Turn pumpkin picking into an epic event with mini golf, inflatables, kids paintball, a fun park, apple cannon, gem mining, fire pit rentals, food galore, and the new “Super Mega Tube Slide”—in addition to 149 different varieties of pumpkins. Those looking to get spooked should check out their nighttime activities, too (hint: there are zombies).
Open Fri, 11a-6p & Sat-Sun, 10a-6p | Every Weekend in October
9010 Marsh Rd | Snohomish
(360) 568-6945
thomasfamilyfarm.com
South of Seattle

Carpinito Brothers Corn Maze & Pumpkin Patch
Rubber duck races, hay slides, corn pit, farm animals, hay maze, & corn maze. New this year: a Giant Pumpkin Weigh-Off on Sun, Oct 4.
Open Daily 9a-6p (or until dusk) | 9/25-10/31
Pumpkin Patch: 27508 W Valley Hwy N | Kent
Farm Fun Yard: 6720 S 277th St | Kent
(253) 854-5692
carpinito.com
Knutson Farms
Don’t miss the 7:30 fireworks shows on Oct. 10th, 17th, & 24th. Corn & hay mazes, petting zoo, cow train, sandboxes, apple cannon, jump pads, & pumpkin bowling, too.
Open Daily 10a-6p (8pm on Fireworks Nights) | 10/3-10/31
16406 78th St East | Sumner
(253) 863-5107
knutsonfarmsinc.com/the-patch
Maris Farms
Racing pigs & ducks, mega slide, corn maze, jump pillow, animals, zip lines, rides, plus the creepy “Haunted Woods” complete with zombies and homicidal maniacs. New this year: fire pit rentals and a daylight “no scares” walk through the Haunted Woods.
Fri & Sat, 10a-10p; Sun, 10a-7p | 9/26-10/31
Last admission is 2 hours before closing. Also open 1-7p on select weekdays. Check here for dates.
25001 Sumner-Buckley Highway | Buckley
(253) 264-5400
marisfarms.com
Mosby Farms
Dog-friendly! Corn maze and fresh farm market.
Open Daily 10a-5:30p | 10/1-10/30
3104 SE Auburn-Black Diamond Rd | Auburn
(253) 939-7666
mosbyfarm.com/pumpkinpatch
Spooner Farms
Corn maze, pumpkin sling shot, speedway, farm animals, caramel apples, & roasted corn.
Open Daily 9a-6p | 9/27-10/31
9710 State Route 162 East | Puyallup
(253) 840-2059
spoonerberries.com
Thomasson Family Farm
Corn maze, wagon rides, play barn, farm animals, duck races, slides, trike track, and games. On weekends there’s also laser tag, an apple slingshot, mega slide, and zip line.
Open Daily 9:30a-5:30p | 9/26-10/30
38223 236th Avenue SE | Enumclaw
contactus@thomassonfamilyfarm.com
thomassonfarm.com

We earn the trust and loyalty of our brokers and clients by doing real estate exceptionally well. The leader in our market, we deliver client-focused service in an authentic, collaborative, and transparent manner and with the unmatched knowledge and expertise that comes from decades of experience.
© Copyright 2026, Windermere Real Estate / Mercer Island.
2026-2027 Football Schedules, Recipes, & Tips

Football fans, preseason is coming soon! Are you ready to party like a champ? The separation is in the preparation, so scroll down for printable pro + college schedules, tailgating hacks (including how to pack the perfect cooler!), and favorite gameday recipes.
Keep everyone entertained—even during commercials—with our printable football bingo sheets. You can also find fun printables for kids at https://www.seahawks.com/junior-12s/ including a downloadable maze, I Spy game, word search, coloring pages, and more.
Need to brush up on your sports lingo? Check out Wikipedia’s handy football glossary. You’ll be able to say impressive things like, “Are they running a 3-4 defense?” and “It’s not intentional grounding outside the pocket if the ball passes the line of scrimmage.”




We earn the trust and loyalty of our brokers and clients by doing real estate exceptionally well. The leader in our market, we deliver client-focused service in an authentic, collaborative, and transparent manner and with the unmatched knowledge and expertise that comes from decades of experience.
© Copyright 2026, Windermere Real Estate/Mercer Island.
How’s the Market? Q2 2026 Review of Seattle Area Real Estate

The real estate market stayed relatively flat in the second quarter with Seattle’s year-over-year numbers holding steady and the Eastside seeing a little more of a lag. Median sales prices dipped slightly in most areas as the supply of available listings increased, but many homes still sold in the first 10 days and at or above their listed prices. The market is fairly balanced for both home buyers and sellers.
This stability feels really comforting in a market full of questions: Will my home sell? How will home shoppers respond to the price? Will they like the color of the countertops we chose? The “X Factor” for coming out on top is (and always has been) having an agent who knows the numbers…trust their spidey-senses on pricing and home prep.
For buyers, now is a prime time to dive into the market…especially if you detest the risk, bidding wars, and lack of good options we’ve seen in recent years. A word of advice to home shoppers: don’t sleep on the one that looks too good to be true. It is, and other people know it, too. Be aggressive if you want to sleep in it one day.
Click or scroll down to find your area report:
Seattle | Eastside | Mercer Island | Condos | Waterfront
SEATTLE
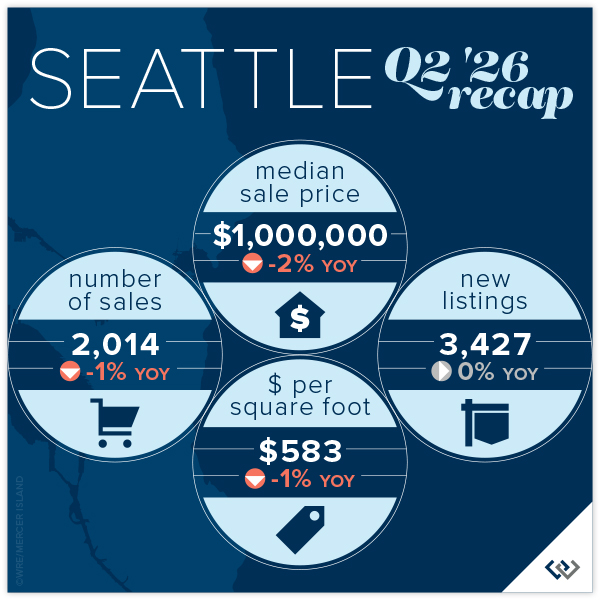
New listings hit a record high of 3,427 last quarter (or at least the 6 year high) up 0.4% YOY and sales tracked very closely behind, down just 0.6% from 2,027 in Q2 2025 to 2,014 in Q2 2026. Median home prices responded by ticking down the tiniest bit, 2% or $20,000, encouraging despite the loss.
There are several bright spots on the Westside. The area South of Seattle posted a 20% gain in total sales along with a 1% rise in median price and was promptly shown up by Lake Forest Park at a 29% increase in sales also with a 1% median price lift. Capitol Hill showed the largest gain in median price at 5% (a $55,000 boost YOY). It’s nice to have a few neighborhoods to “shout out” in a YOY landscape that is relatively flat. In this case that is flat read: stable and predictable. A reprieve from the world around us.
59% of homes sold in the first 10 days and a whopping 67% of homes sold at or above list price. It’s still a good time to make a move!
Click here for the full report and neighborhood-by-neighborhood statistics!

EASTSIDE
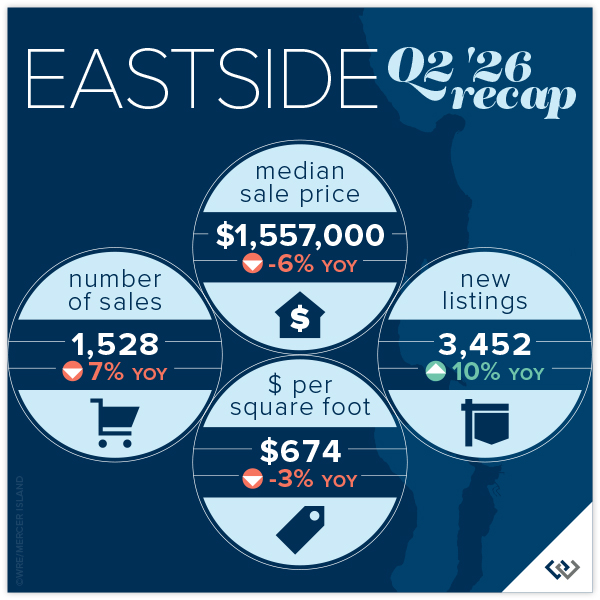
New listings hit a record high of 3,452 last quarter (or at least the 6 year high) and it appears that home shoppers were excited by the new inventory! 1,528 sales posted in Q2 of 2026. Even with this great news we are still living in a “feast or famine” era. With 3.7 months of Eastside inventory, again the highest we’ve seen in more than 6 years, it’s encouraging to see that 22% of homes sold with multiple offers. This lends statistical proof to what your agent has always told you: well prepared, strategically priced, “good” homes will be exciting in any market.
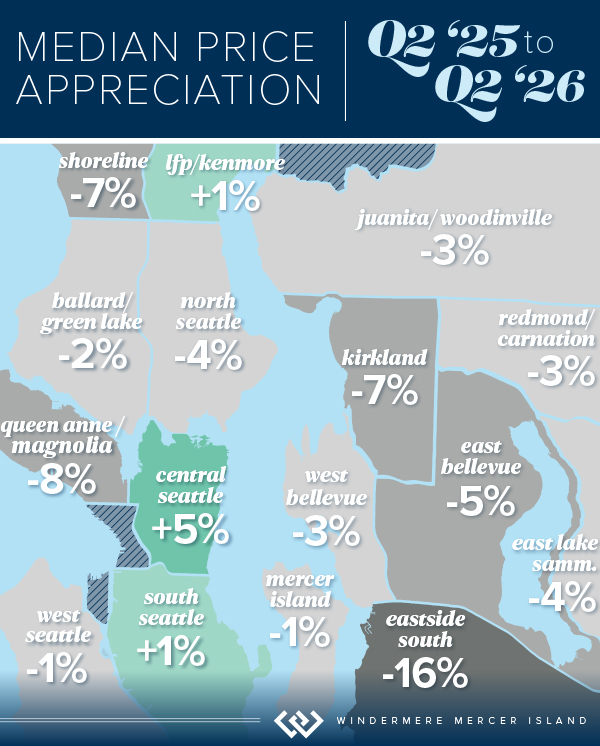
The median home price is down across the board, which makes sense given that sales are down 7% YOY and new listings are up YOY from 3,145 to 3,452 (10%). Mercer Island shows the lowest “dip” at a rounding error 1% drop in median price, while the area South of I-90 saw a 16% adjustment in the median dropping from $1,850,000 to $1,560,000.
If you’re thinking about “throwing your house in the ring,” it’s a coin toss: 51% of homes sold for at or above list and 52% of homes sold in the first 10 days. Proper pricing and preparation are key to beating those odds.
Click here for the full report and neighborhood-by-neighborhood statistics!

MERCER ISLAND
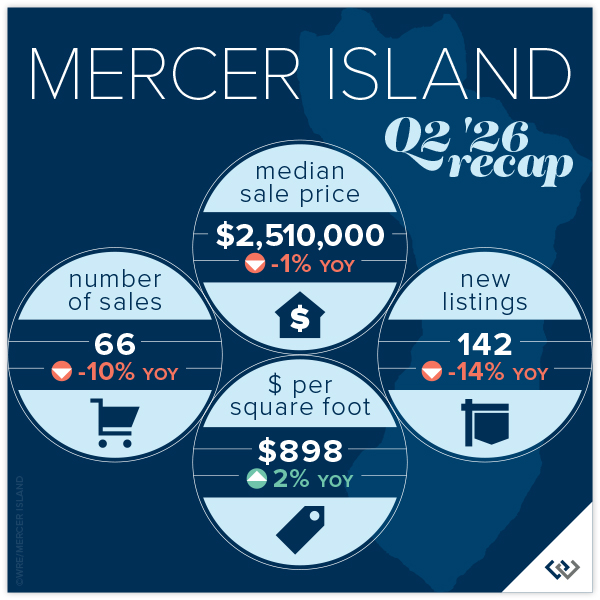
It appears that homeowners went into Q2 bullish on pricing and home shoppers did not share that value outlook; evidenced by the fact that 59% of homes sold for below asking price on Mercer Island. The median price is down during spring market for the second time in as many years, falling only 1% compared to 3% from 2024 to 2025. Moderate but still a sign that home prices are at their peak.
New listings are down 14% YOY and sales are down 10%. Even though this appears negative, we’re encouraged because of the relationship between these numbers. If new listings were up and sales were down or if sales were down less than new listings these would predict a worse outcome. You have to find a silver lining in a flat market.
With only 2 condo sales in Q2, the only conclusions we can really draw are 2 bedroom condos are the most popular product. There were 12 new listings and 9 listings at the end of the quarter which means at least one homeowner gave up. There are currently 12.9 months of condo inventory. With such little product it will only take a few sales in Q3 to drastically shift the market.
Click here for the full report and neighborhood-by-neighborhood statistics!
CONDOS – SEATTLE & EASTSIDE
The median price for Seattle condos dropped 7%, or $40,000, YOY. When you dig into the numbers this seems to be coming mostly from a 28% dip in North Seattle, which may just be from an easing in new construction condo-ized DADU listings. Across the rest of the landscape numbers are relatively flat and South Seattle posted a 9% gain!
On the Eastside there was an 11% dip in median prices led equally by Redmond, Woodinville and West Bellevue (all around 25% dips). These were balanced by more modest adjustments across the rest of the area with Mercer Island posting a 1% gain.
There is good news: 30% of condos sold in the first 10 days and 49% sold at or above list price across the region. This isn’t weighted in one direction, with relatively similar numbers posted both on the Eastside and in Seattle.
Check out area-by-area details in the full condo report.
WATERFRONT
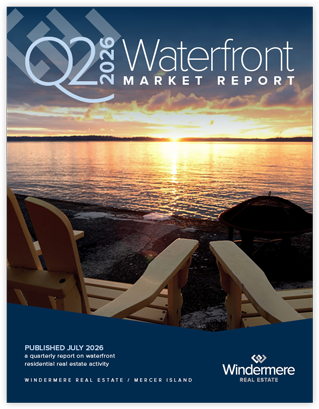
Seattle and the Eastside both had a whopping 14 waterfront home sales in Q2, up significantly compared to Q2 of last year. Mercer Island also saw a year-over-year boost in sales from 4 to 6, while Lake Sammamish had a quieter quarter with just 5 sales compared to 13 in Q2 of 2025.
Hunts Point took the cake for highest sale with a 4.3-acre estate on over 300 feet of waterfront that went for a jaw-dropping $38 million. On the other end of the spectrum was a super cute, remodeled 1908 Rainier Beach home with 10 feet of waterfront that sold above asking price for $1,160,000.
This brief overview of the entire Seattle-Eastside private waterfront market, including Mercer Island and Lake Sammamish, illustrates the trends occurring in our region over time. This data is interesting and insightful but cannot replace an in-depth waterfront analysis with your trusted professional.
View the full waterfront report
We earn the trust and loyalty of our brokers and clients by doing real estate exceptionally well. The leader in our market, we deliver client-focused service in an authentic, collaborative, and transparent manner and with the unmatched knowledge and expertise that comes from decades of experience.
© Copyright 2026, Windermere Real Estate/Mercer Island. Information and statistics derived from Northwest Multiple Listing Service and Trendgraphix, and deemed accurate but not guaranteed.
Seattle report cover photo courtesy of Codi Nelson and Brad Crossen, HD Estates Photography.
Eastside report cover photo courtesy of Mike Ferreri and Kell Morrissey, Clarity NW Photography.
Mercer Island report cover photo courtesy of Petra Varney and Amaryllis Lockhart, Clarity NW Photography.
Condo report cover photo courtesy of Jake Kanev and FOCUSED Media Collective.
Homes That Earn Their Keep: Boost Your ROI with a Rental Unit
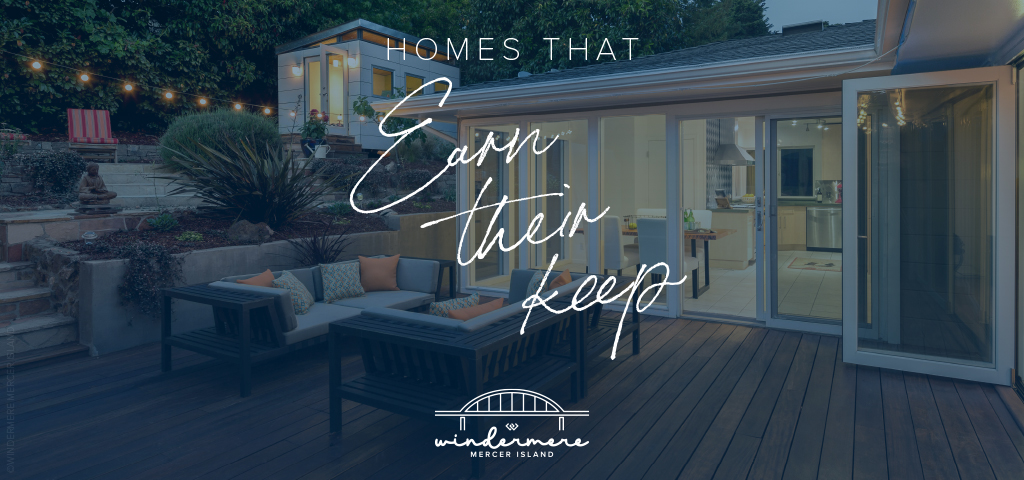
Do you have extra space in your home or on your property? You may be able to put it to work as a rental and boost your ROI! With rising interest rates and inflation putting economic pressure on homeowners, rental apartments and tiny houses can be a great way to offset those higher costs. Some homeowners are even living in the ADU unit themselves while a renter in the main unit helps pay the mortgage for the property. For seniors, the cost offset from a rental unit can be enough to allow them to age in place in their own home.
Easing regulations from Washington State’s middle housing bill (HB 1337, in addition to HB 1110) have made it easier to add an ADU, DADU, or duplex in areas that previously didn’t allow it (read our full article on permitting and regulations for ADUs). Here is the rundown on how to turn your extra spaces into profit…
THE RIGHT SPACE…
Whether you’re converting your existing property or looking to invest in something new, there are many options for creating a rent-able space. Just make sure you’re following local requirements (size, parking capacity, set-backs, etc.) set by your local city or county. ADUs require a special permit—here is a guide to permitting requirements throughout Washington State. If you’re considering adding an ADU/DADU, check out this article on the benefits, risks, and things to consider.
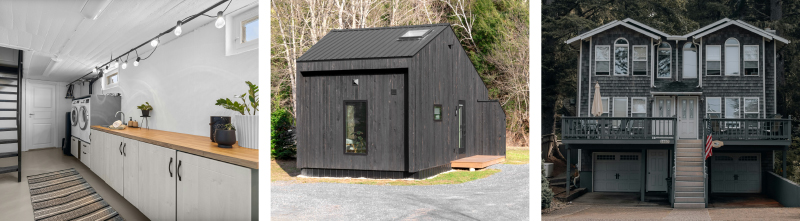
- ADUs (Accessory Dwelling Units), also known as in-law apartments, often take shape in converted basements, attics, or garages. They are self-contained living quarters within a larger single-family property that usually include their own kitchen/kitchenette, sleeping area, bathroom, and separate entrance.
- DADUs (Detached Accessory Dwelling Units) are ADUs that not physically connected to the main residence, sometimes referred to as tiny houses or granny cottages. They can either be constructed traditionally or installed as a prefab/modular unit. If you live in Seattle, consider using one of the 6 pre-approved ADU designs provided by the city; they speed up the permitting process from months to just weeks. You can even order pre-fab DADUs on Amazon.
- Small multi-family properties (like duplexes) have units that are typically larger, offer more privacy, and fetch higher rents than ADUs. However, they have special zoning requirements and may require special multi-family or investment financing. With the passage of Washington State House Bill 1110, they are permitted in many more areas than previously allowed.
THE RIGHT RENTAL TERM…
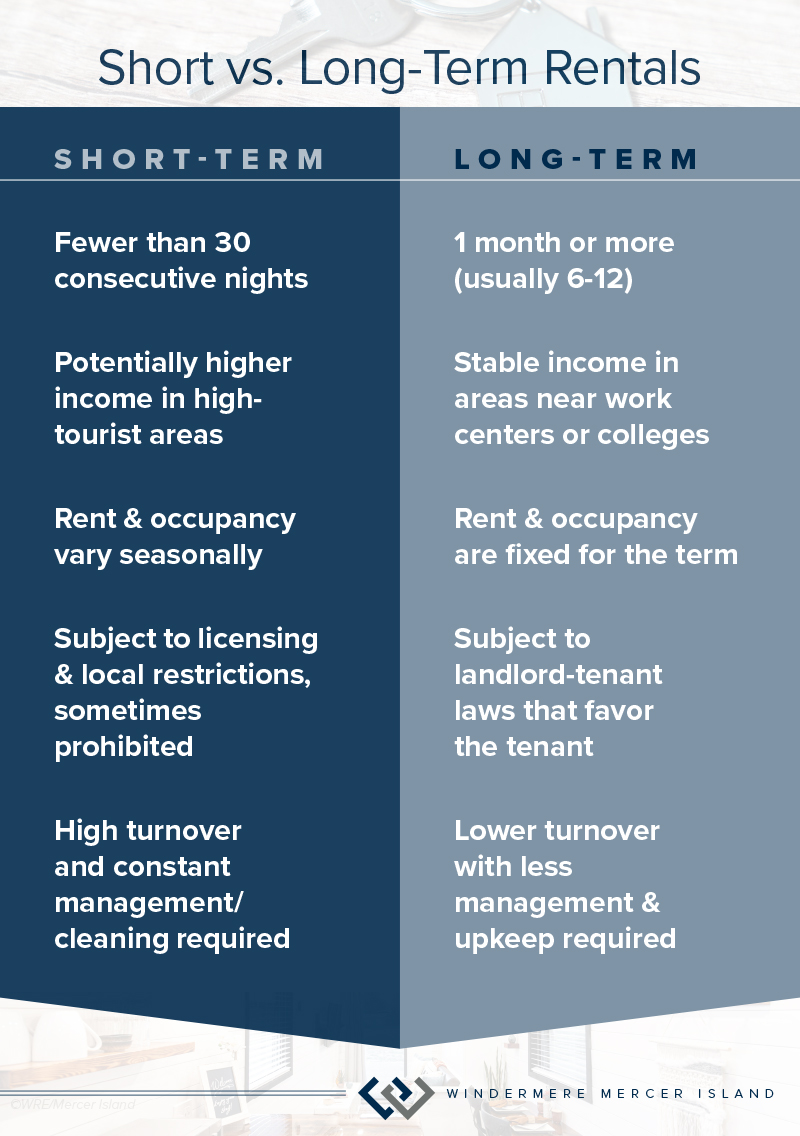
Once you determine the type of space you’d like to create, the next decision is whether you’ll be offering it as a long-term or short-term rental. Traditional long-term rentals with multi-month leases offer a stable income and are a great choice if your potential tenant would be working or attending school nearby. The low turnover rate also makes them relatively easy to manage apart from monthly rent collection and occasional repairs. The cons are that you have less flexibility to adjust the rent and are subject to often strict landlord-tenant laws that tend to strongly favor the tenant.
If you’re in a hot tourist area, offering your unit as a short-term rental on a platform like airbnb.com or vrbo.com can be a more lucrative option. Rental rates are typically much higher, however both rent and occupancy can vary seasonally. They also require constant management/cleaning due to their high turnover rate. Short-term rentals are subject to special licenses and restrictions, and are sometimes banned entirely by the city or your neighborhood Home Owner’s Association (HOA). Washington State also has special tax, insurance, and safety laws for short-term rentals.
No matter which type of rental you opt for, it is critical to do your homework and research requirements for licensing/permitting of rental properties in your community. From there you can delve deeper to estimate what your expenses and expected monthly rental income might be.
THE RIGHT PRICE…
Before you invest money into converting, building, or or purchasing a property with a rental unit, it is critical to compare estimated costs with the average rent for that type of unit in your area. The 2% rule in real estate investing holds that your expected monthly rent should be at least 2% of the purchase/construction price for it to be a good value. For example, if ADUs rent for $2,000/mo in your area then you should spend less than $100,000 on establishing an ADU. Here are the average ADU costs as of March 2026 according to WashingtonContrators.org:
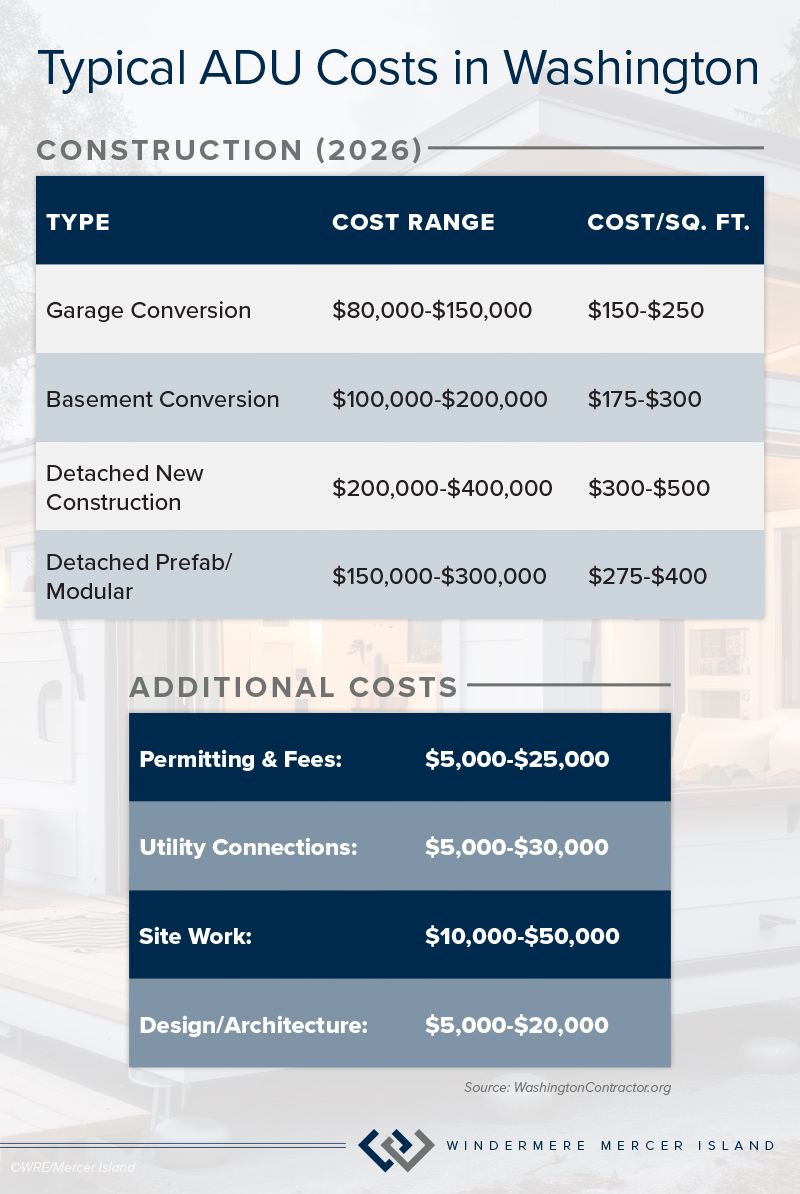
Did you know that HB 1337 also allows homeowners to sell an ADU separately from their main property? If you’re thinking about buying or selling a property with rental space, reach out to me to discuss the pros, cons, and pricing for your unique property. You can also check out these articles on how to design your rental to feel like a home, renovating short-term rentals, and tips to give your short-term rental a competitive advantage.

We earn the trust and loyalty of our brokers and clients by doing real estate exceptionally well. The leader in our market, we deliver client-focused service in an authentic, collaborative, and transparent manner and with the unmatched knowledge and expertise that comes from decades of experience.
© Copyright 2026, Windermere Real Estate/Mercer Island.
2026 Seattle & Eastside Farmers Markets

Wow, spring has sprung and 2026 is flying by…ready to renew your New Year’s resolution to eat better? Nothing makes it easier than a wide array of fresh, locally picked fruits and veggies. Add in some live music, amazing street food, and that feel-good knowledge that you’re supporting small businesses, and it’s a recipe for a great time. Here are all of the details so you can find a market near you or explore somewhere new…
Seattle Metro
- Ballard
- Capitol Hill (Broadway)
- Central District (Madrona)
- Columbia City
- Fremont
- Lake City
- Lake Forest Park
- Madison Park
- Magnolia
- Phinney
- Pike Place
- Queen Anne
- Shoreline
- South Lake Union – Thursday Market
- South Lake Union – Saturday Market
- U-District
- Wallingford
- West Seattle
Greater Eastside
- Bellevue – Crossroads
- Bellevue – Downtown
- Carnation
- Duvall
- Issaquah
- Kirkland – Downtown
- Kirkland – Juanita
- Mercer Island
- North Bend
- Redmond
- Renton
- Sammamish
- Woodinville

Seattle Metro
Ballard
Seattle’s first year-round Farmers Market, selling produce exclusively from Washington state farmers along the historic cobblestone stretch of Ballard Ave.
Sundays, 9am – 2pm | Year-Round
5345 Ballard Ave NW | Seattle
sfmamarkets.com/visit-ballard-farmers-market/
Capitol Hill (Broadway)
Come for Sunday brunch from food vendors who source ingredients from local, WA state farms (many of whom you’ll also meet selling their wares at the market). Live music and street performers often make an appearance, too.
Sundays, 11am – 3pm | Year-Round
Tuesdays, 3pm – 7pm (June 2 – September 29, 2026)
E Barbara Bailey Way | Seattle
seattlefarmersmarkets.org/chfm
Central District (Formerly Madrona)
Located in one of Seattle’s most diverse neighborhoods, you’ll find artisan foods as well as seasonal produce from Washington state farmers, fishers, and ranchers.
Fridays, 3pm – 7pm | May 15 – Oct 30, 2026
MLK Way & E Union St | Seattle
sfmamarkets.com/central-district-farmers-market
Columbia City
With everything from freshly harvested Asian greens to Ethiopian eats, come check out the immense variety King County’s most diverse zip code has to offer. Bring your bounty to adjacent Columbia Park for a picnic.
Wednesdays, 3pm – 7pm | May 6 – Oct 28, 2026
37th Ave S & S Edmunds St | Seattle
seattlefarmersmarkets.org/ccfm
Fremont
Seattle’s largest weekly street market is set along the Fremont Canal, and you can find just about everything at this “hyper market”—an eclectic mix of a farmer’s market, flea market and artists’ alley. The brunch food is pretty epic, too!
Sundays, 10am – 4pm
March 29-October: 3401 Evanston Ave N | Seattle
Nov-March: 701 N Northlake Way | Seattle
fremontmarket.com
Lake City
This celebrated North End seasonal market offers unique finds grown and prepared by local farms and food artisans. Enjoy kids’ activities, too!
Thursdays, 3pm – 7pm | June 4 – Sept 24, 2026
Saturdays, 10am – 2pm | Oct 3 – Dec 19, 2026
NE 125th St & 28th Ave NE | Seattle
seattlefarmersmarkets.org/lcfm
Lake Forest Park
With an emphasis on fresh, locally grown food, this market is an epicurean’s delight. Browse hard cider, baked goods, preserves, meat, pasta, sauces, and prepared foods along with the locally harvested fruits and veggies. There is also one “Crafts Market” each summer featuring local artisans.
Sundays, 10am – 2pm | May 10 – Oct 18, 2026
17171 Bothell Way NE | Lake Forest Park
www.thirdplacecommons.org/farmers-market
Madison Park
Stretching right alongside the park with its bathhouse and swimming beach, you’ll find ample produce from Washington State farms as well as delectable hot food vendors.
Saturdays, 10am – 2pm | May 16 – Oct 17, 2026
E Madison St & 42nd Ave E | Seattle
www.sfmamarkets.com/madison-park-farmers-market
Magnolia
This popular Saturday market is nestled in the tree-lined Magnolia Village. In addition to seasonal fruits and veggies, you’ll find sweet & savory pies, fresh bread, flowers, and more!
Saturdays, 10am – 2pm | June 6 – Oct 10, 2026 + Nov 21 & Dec 5
W McGraw St & 33rd Ave W | Seattle
seattlefarmersmarkets.org/mfm
Phinney
A popular gathering spot for both the Phinney Ridge and Greenwood communities, this market is right next door to a playground and offers live music in addition to the great mix of fresh produce and prepared food.
Fridays, 3pm – 7pm | June 5 – Sept 25, 2026 + Harvest Market on Nov 20
6532 Phinney Ave N | Seattle
seattlefarmersmarkets.org/pfm
Pike Place
Produce on Pike extends the standard market with pop-up tents from local farmers along the north end of Pike Place. Of course, you can come enjoy the historic indoor market any time…make it a day with great restaurants, eateries and retail shops, too.
Produce on Pike Farmers Market:
Wednesdays, 3pm – 7pm | June 24 – Sept 9, 2026
Stewart Street & Pike Place | Seattle
pikeplacemarket.org/farmers-markets
Indoor Market:
Daily, 9am – 6pm (farm tables close at 4pm) | Year-Round (Closed Thanksgiving & Christmas)
Pike Place between Pine & Virginia St | Seattle
(206) 682-7453
pikeplacemarket.org
Queen Anne
Seattle’s only independent farmers market, offering food, chef demos, live music, and children’s activities.
Thursdays, 3pm – 7:30pm | May 28 – Oct 8, 2026
Spring Preview Market on Sat, May 9, 2026, 10am-3pm
Saturday Harvest Markets on Oct. 31 & Nov. 21, 10am-3pm
Queen Anne Ave N & W Crockett St | Seattle
qafm.org
Shoreline
Now located at the BikeLink Park & Ride (corner of 192nd & Aurora, across from Sky Nursery), this market offers kids’ programs and live music in addition to its fresh Washington produce, organic meats, bread, honey, and prepared foods.
Saturdays, 10am – 2pm | June 6 – Oct 31, 2026
18821 Aurora Ave N | Shoreline
shorelinefarmersmarket.org
South Lake Union – Mini Thursday Market
Affiliated with Pike Place Market, this small satellite market offers locally sourced veggies, fruits, flowers, honey, jam, and organic meats from the region’s finest farms.
Thursdays, 10am – 2pm | June 4 – Oct 29, 2026
426 Terry Avenue N | Seattle
pikeplacemarket.org/farmers-markets/
South Lake Union – Saturday Market
This year, the former maker’s market is evolving into a full blown farmers market complete with over 100 booths and Space Needle views.
Saturdays, 10am – 3pm | June 6 – Nov 21, 2026
2100 6th Ave | Seattle
slumarket.com
University District
Come visit Seattle’s largest and oldest farm/food only market, regularly recognized as one of the best farmers markets in the U.S.! With over 80 booths and hard-to-find ingredients, it’s a chef’s delight.
Saturdays, 9am – 2pm | Year-Round
University Way NE (the “Ave”) between 50th & 52nd | Seattle
seattlefarmersmarkets.org/udfm
Wallingford
Located in Meridian Park, you can shop with the whole fam and then enjoy a picnic or playtime at the award-winning playground.
Wednesdays, 3pm – 7pm | May 27 – Sept 30, 2026
4800 Meridian Ave N | Seattle
sfmamarkets.com/visit-wallingford-farmers-market/
West Seattle
A weekend destination for families across the area, this market is set in the vibrant West Seattle Junction and features 90+ vendors during the summertime peak. Great community atmosphere celebrating Washington grown food and ingredients.
Sundays, 10am – 2pm | Year-Round
California Ave SW & SW Alaska | Seattle
seattlefarmersmarkets.org/wsfm
Greater Eastside
Bellevue – Crossroads
East Bellevue’s market features fruits, veggies & dairy products from Washington state farms along with hand crafted bird houses, candles, dog accessories, herbal wellness products, and more. Don’t miss the tacos, Nepalese street food, and handmade ice cream sandwiches, too!
Tuesdays, 12pm – 6pm | June 2 – Sept 29, 2026
15600 NE 8th St | Bellevue
https://crossroadsbellevue.com/music-events/crossroads-farmers-market/
Bellevue – Downtown
Set in the heart of Downtown Bellevue, this market offers goods exclusively produced within Washington state—from seasonal fruits & veggies to flowers, fresh meats, artisan goods, and prepared cuisine. The Power of Produce (POP) club empowers kids to know where their food comes from and make healthy eating choices.
Thursdays, 3pm – 7:30*pm | May 21 – Oct 1, 2026
*Closes at 7pm in Sept & Oct
Harvest Market: Nov 21, 10am – 3pm
1717 Bellevue Way NE | Bellevue
bellevuefarmersmarket.org
Carnation
Set in the heart of the Sno-Valley farming district, you’ll find plenty of freshly picked produce along with live music and educational activities for the kids.
Tuesdays, 3pm – 7pm | June, July & August 2026
Tolt-MacDonald Park, 31020 NE 40th St | Carnation
carnationfarmersmarket.org
Duvall
Nestled alongside the scenic Snoqualmie River, this friendly market features local eggs, jams, fresh roasted coffee, arts, crafts, and baked goods in addition to the seasonal veggies, fruits, and plant starts. Live music, picnic shelters and a playground make this a fun family destination.
Thursdays, 3pm – 7*pm | May 7 – October 8, 2026
*Closes at Sunset in October
Taylor Landing at 16201 Main St NE | Duvall
Parking Map
duvallfarmersmarket.org
Issaquah
Located at the historic Pickering Barn, this picturesque venue offers a variety of fresh farm and food-based products, concessions, and local artisans.
Saturdays, 9am – 2pm | May 2 – Sept 26, 2026 + Holiday Market Dec 12
Pickering Barn, 1730 10th Ave NW | Issaquah
Market Map
www.issaquahwa.gov/778/Farmers-Market
Kirkland – Downtown
This stunning setting on the Lake Washington shoreline turns shopping into a day at the beach. Peruse local produce and goods, then go for a swim or stroll along Moss Bay. Perfect for a picnic, too!
Wednesdays, 3pm – 7pm | June 3 – September 30, 2026
Marina Park, 25 Lakeshore Plaza | Kirkland
kirklandmarket.org
Kirkland – Juanita
Set in beautiful Juanita Beach Park on Lake Washington, you’ll find as many as 30 vendors offering farm fresh local produce, herbs, honey, nuts, flowers, plants, baked good, handcrafted items, and prepared cuisine. Make it a date with live music and a picnic at the beach. There’s a great playground for the kids, too.
Fridays, 3pm – 7pm | June 5 – Sept 25, 2026 (Closed June 19 & July 3)
Juanita Beach Park, 9703 NE Juanita Dr | Kirkland
www.kirklandwa.gov
Mercer Island
Come on down for quality local Washington state produce, cheese, fish, meat, bread, and more. Check out the live music schedule, too!
Sundays, 10am – 2pm | May 31 – Oct 11, 2026
Mercerdale Park, 7700 SE 32nd St | Mercer Island
www.mifarmersmarket.org
North Bend
This relaxed market enjoys live music and a spectacular Mount Si view. Vendors offer fresh produce, berries, honey, flowers, baked goods, hand-crafted items, and delicious prepared foods. Kids can participate in the Power of Produce (PoP) Club. Two playgrounds plus play fields and a covered picnic shelter make this a fun hangout spot. Leashed pets are welcome, too!
Thursdays, 4-8*pm | June 4 – Sept 3, 2026
*3:30 pm – 7:30 pm on Aug 27 & Sept 3
Si View Park, 400 SE Orchard Dr | North Bend
www.siviewpark.org/farmers-market.phtml
Redmond
Going strong since 1976, the Redmond Saturday Market offers a huge selection of vendors and dazzling array of produce, flowers, cheeses, preserves, salmon, tea, and handmade goods such as pottery and soaps. You’ll love the ready-to-eat foods, too.
Saturdays, 9am – 2pm | May 2 – Oct 31, 2026 (Closed May 9th)
9900 Willows Rd NE | Redmond
www.redmondsaturdaymarket.org
Renton
Find exclusively Washington-produced fruits, veggies, handmade goods, arts, crafts and more right in the heart of downtown Renton. Food trucks, live music, and kids’ activities make this a fun spot to liven up your Tuesday. Note: for 2026, the market returns to Piazza Park!
Tuesdays, 3pm – 7pm | June 2 – Sept 29, 2026
Piazza Park at 233 Burnett Ave S | Renton
www.rentonfarmersmarket.com
Sammamish
Each Wednesday, the Sammamish Commons plays host to a variety of local farmers, nurseries, bakeries, artisans, food vendors, and more. Live music and kids’ activities, too! Check out their special themed days including Soccer Fest and Pride Day.
Wednesdays, 4-8*pm | May 6 – Sept 9, 2026
*3-7 pm in Sept
Sammamish Commons, 801 228 Ave SE | Sammamish
Parking: Mary, Queen of Peace Catholic Church, 1121 228th Ave SE
www.sammamishfarmersmarket.org
Woodinville
Come check out downtown Woodinville’s Schoolhouse District and find produce grown in the state of Washington (and picked fresh for that morning!). You’ll also have an array of boutique baked goods, sauces, cider, artisans, and more to peruse.
Saturdays, 10am – 2pm | May 2 – Sept 26, 2026
13205 NE 175th St | Woodinville
woodinvillefarmersmarket.com
We earn the trust and loyalty of our brokers and clients by doing real estate exceptionally well. The leader in our market, we deliver client-focused service in an authentic, collaborative, and transparent manner and with the unmatched knowledge and expertise that comes from decades of experience.
© Copyright 2026, Windermere Real Estate/Mercer Island.
How’s the Market? Q1 2026 Review of Seattle Area Real Estate

Across the region, median sales prices were lower than we saw at this time last year. The likely cause: more homes are hitting the market, but buyers (rattled by rising rates, layoffs, and an uncertain economy) aren’t keeping pace. That being said, we are still seeing many homes sell in their first 10 days on market with the choicest homes drawing multiple offers and selling above the asking price. The market is complex and every home is different…part of my job is to look beyond the averages to get a clearer understanding of what is happening at the neighborhood level.
Despite the push in interest rates, it continues to be a good time to invest and find the right home! Buyers who are up-sizing have a special advantage when prices dip since the money they save on their purchase often exceeds the lower ROI from their sale.
Click or scroll down to find your area report:
Seattle | Eastside | Mercer Island | Condos | Waterfront
SEATTLE
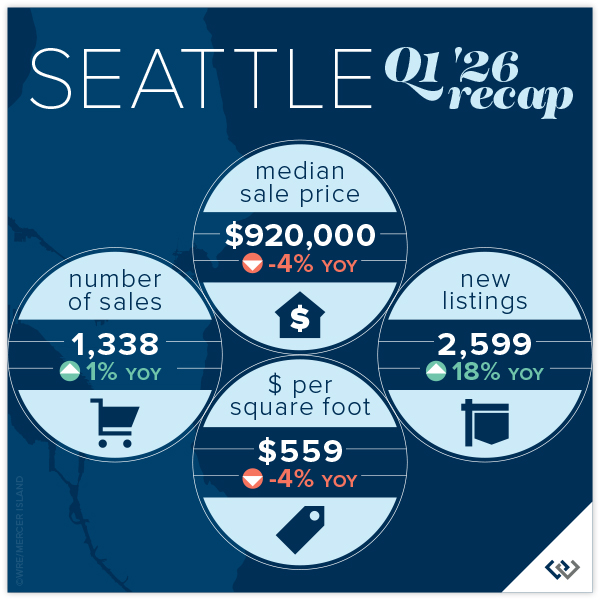
When you look past the overall data, Seattle real estate is firing on all cylinders. Even though the median price is down YOY from $958,000 in 2025 to today’s $920,000 the actual median price point is hot, in city. We’re hearing tales of multiple offers in the $800,000-$1,200,000 price range from all corners of the core Seattle neighborhoods. 67% of homes sold for at or above list price, those that sold above sold for 104% (median) over list! The entire market average list to sales price is 101%, which bodes well for gains YOY in Q2.
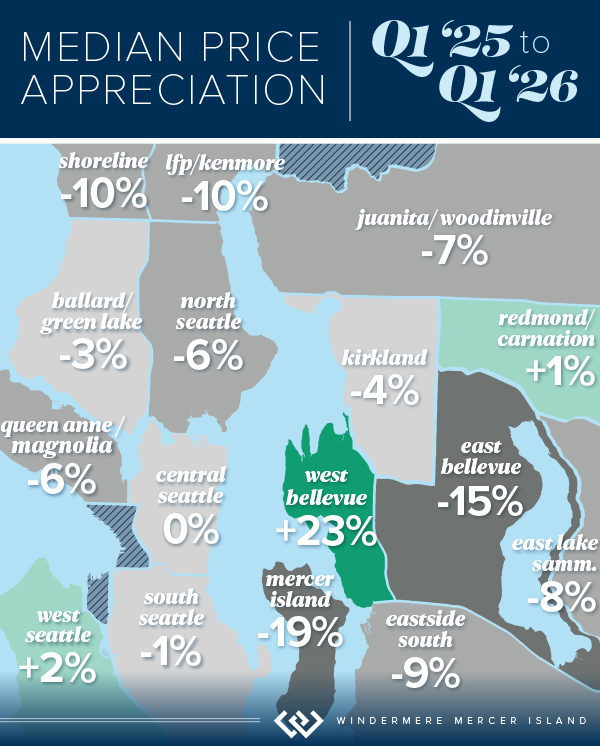
West Seattle and Madison Park seem to be carrying the market, the only two neighborhoods to post stable or even a modest gain in price. Maybe not so ironically, Shoreline and Lake Forest Park saw among the highest gain in overall sales volume but also the biggest losses in median price at 10%. Shoppers are savvy and know when they’ve found a deal.
While our market is facing existential pressure from things like rising interest rates, war, and talks of recession; the city hasn’t looked this beautiful in years as officials prepare for World Cup festivities in a few months. There is always a bright side, and homebuyers appear to be seeing the silver lining as they consider their long-term investment plans. If you’ve thought about selling your home in 2026, we think this could be a great year: sales are happening, 55% within the first 10 days.
Click here for the full report and neighborhood-by-neighborhood statistics!
EASTSIDE
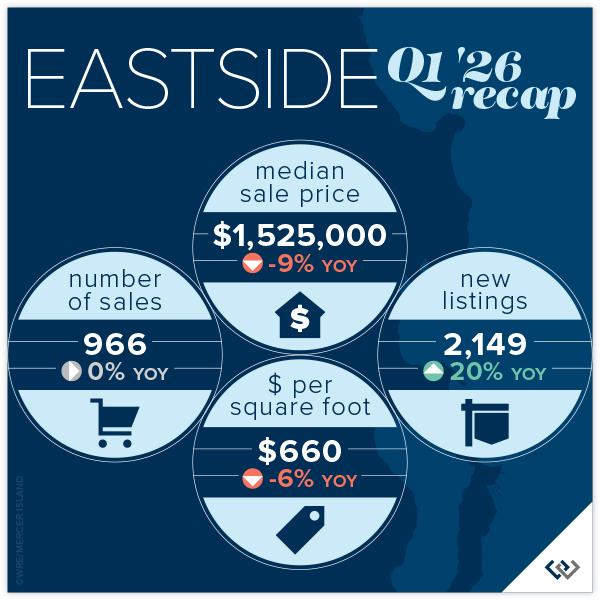
While median prices across the Eastside fell from $1,678,000 in Q1 2025 to $1,520,000, this quarter there are still bright spots. Namely, West Bellevue whose median price jumped 23% YOY. Though while the total number of sales were up in nearly every Eastside city, West Bellevue’s 36% dip drug the market down to report flat total sales: 966 at the end of Q1 2026 compared to 969 in the same period last year.
Mercer Island reported a region-wide high gain in average price per square foot at 14%, and West Bellevue was not far behind at 2%. All other neighborhoods had dips, topped by Redmond which fell 10%.
New listings rose 20% YOY, and this could mean many things but we think the two most likely are: home sellers got a head start in 2026 (we predict fewer new listings in Q2 than last year when new inventory nearly doubled from one quarter to the next) OR everyone else is as bullish about the market as we are. List to sales price ratios are at 99% on average and 51% of homes sold in the first 10 days. If you find the right home, don’t be afraid to jump.
Click here for the full report and neighborhood-by-neighborhood statistics!
MERCER ISLAND
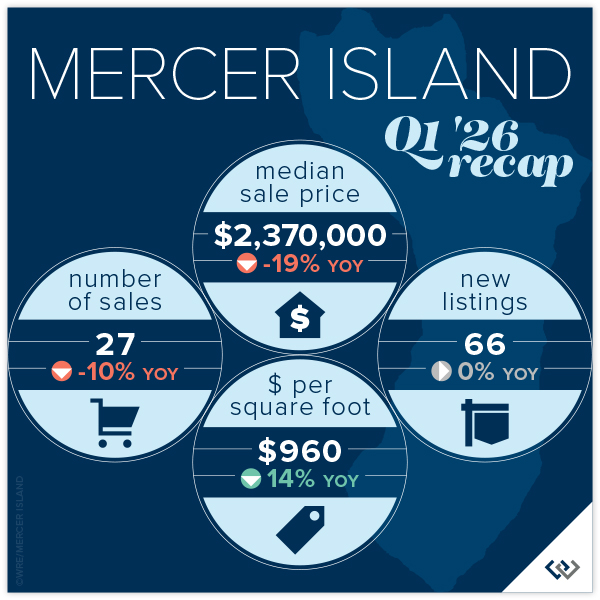
Island real estate seems to be off to a slow start in 2026 with median prices slipping YOY from $2,937,000 in 2025 to $2,370,000 in 2026. This is likely due to a spike in the months of inventory: 4.7 up from 2.9 last Q1. The months of inventory is a barometer for which way prices trend. High inventory = falling prices, supply/demand. That said, 60% of all homes sold for at or above list price and 63% sold in the first 10 days. Both of these numbers are indicators that homeowners are pricing to sell.
The condo market appears to be healthy this spring. Even though there are only 8 total sales that number is up a whopping 60% YOY. Median price is down 33%, but this is a rounding error with only 8 data points this year and 5 last year. A better indicator of market health is a 2.2 months supply of inventory, which is outpacing pretty much any segment of the market!
While our market is facing existential pressure from things like rising interest rates, war, and talks of recession; Mercer Island is now the “Bridge” in a whole new way with light rail open from Seattle to the Eastside. It will be interesting to see how this fun change affects the market as a whole.
Click here for the full report and neighborhood-by-neighborhood statistics!
CONDOS – SEATTLE & EASTSIDE
Seattle condo sales are up 8% over Q4 2025, an incredible seasonal boost. Though, the median price is down 6% YOY to $596,000. 25% of listed condos sold in the first 10 days and 48% of all condos sold for at or above list price. This tells us that agents and homeowners are tuned in to what a homebuyer in today’s market expects.
On the Eastside it’s a very similar story. Inventory is at 5.1 months. Meaning: at the current pace of sales, if no new listings came on the market, it would take nearly half a year to sell through the current inventory. That’s the highest since before 2020, the six year low was Q4 of 2021. Prices seem to reflect this, with an 11% dip in median home price down to $655,000 from Q1 2025: $740,000.
If you’ve thought about selling your condo in 2026, prepare for a highly saturated market where you’ll need to whip your unit into tip-top shape and price competitively to attract buyers. Inventory is up a combined 5%, while sales are down 21%. This is a big gap that will definitely create downward pressure on pricing if the gap between demand and supply widens. If you have the luxury to wait and watch, that might be your best option. If you’ve thought about buying, this is an excellent year to consider your options. Just remember, if you find the right nest and it hasn’t been on the market long: jump in! The good ones don’t last.
Check out area-by-area details in the full condo report.
WATERFRONT
Seattle and the Eastside both had fewer waterfront sales this quarter than we saw in Q1 of 2025, whereas Lake Sammamish posted the same number of sales and Mercer Island saw a boost. The vast majority of homes sold at or below their listed prices with the exception of one mid-century Magnolia home on 75 feet of waterfront that garnered over $300k above and beyond its original asking price.
The highest sale was in Hunts Point at $17+ million for a stunningly reimagined English Tudor on 3/4-acre with extensive waterfront. The most modest sale was in Rainier Beach: an original 1980 home on 50 feet of waterfront that went for $1,640,000.
This brief overview of the entire Seattle-Eastside private waterfront market, including Mercer Island and Lake Sammamish, illustrates the trends occurring in our region over time. This data is interesting and insightful but cannot replace an in-depth waterfront analysis with your trusted professional.
View the full waterfront report

We earn the trust and loyalty of our brokers and clients by doing real estate exceptionally well. The leader in our market, we deliver client-focused service in an authentic, collaborative, and transparent manner and with the unmatched knowledge and expertise that comes from decades of experience.
© Copyright 2026, Windermere Real Estate/Mercer Island. Information and statistics derived from Northwest Multiple Listing Service and Trendgraphix, and deemed accurate but not guaranteed.
Seattle report cover photo courtesy of The Sirianni Group; and Andrew Webb, Clarity NW Photography.
Eastside report cover photo courtesy of Tori Franzen; and Michael Tilzer Photography.
Mercer Island report cover photo courtesy of Julie Wilson; and Chris Neir, Clarity NW Photography.
Condo report cover photo courtesy of Marianne Parks; and Christopher Cooper, Clarity NW Photography.
Strategic Investments to Boost Value & Curb Appeal

When it’s time to sell your home, one of the biggest questions is how to make it as appealing as possible to today’s buyers. While market conditions, location, and timing all play a role, the updates you choose before listing can make a meaningful difference in both your selling price and how quickly your home goes under contract. The key is knowing where to invest your time and money. Not every project pays off, but some smart upgrades can give your home a competitive edge, help it stand out in online listings, and create the kind of first impression that gets buyers excited.
Here are some of the most impactful ways to invest in your home before putting it on the market.
Fresh Paint and a Neutral Palette
Few improvements have a more substantial return on investment than paint. A fresh coat instantly refreshes a space, making it feel clean, updated, and well-maintained. In fact, a recent report1 by the National Association of REALTORS® found that painting is the #1 project agents recommend sellers do before selling.
Neutral tones for interiors, such as light beige, soft grays, and crisp whites, appeal to the broadest audience and allow buyers to envision their own style in the home. Check out the Sherwin-Williams Colormix Forecast 2026 for some up and coming hues (and opt for the lightest shades). It’s crucial not to overlook trim, doors, and even ceilings, as these small details help create a polished, move-in-ready feel. And if your front door could use a pop of personality, consider a bold, welcoming color that complements the rest of the exterior.
Curb Appeal That Counts
Buyers often form an impression before they even step inside. Landscaping, exterior lighting, and simple maintenance go a long way toward making your home inviting. Think trimmed hedges, fresh mulch, pressure-washed walkways, and a tidy lawn. It’s also smart to ensure outdoor areas are safe, from repairing uneven paths to addressing any obvious hazards. Here is a printable checklist so you don’t miss anything.
Adding planters with seasonal flowers, updating house numbers, or swapping out an old mailbox can elevate your home’s appearance without requiring a significant investment. For buyers scrolling through listings, that curbside charm can be a deciding factor that gets them to schedule a showing.
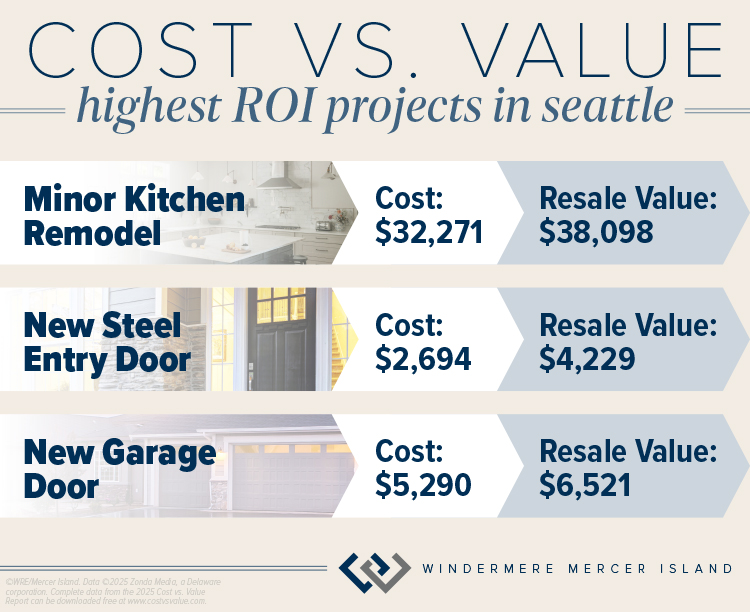
According to the latest Cost vs. Value report for Seattle2, exterior curb appeal investments such as a basic new front door or garage doors can net you a profit when it’s time to sell:
Kitchen and Bathroom Touch-Ups
Kitchens and bathrooms continue to be high priorities for buyers, but you don’t need to take on a full remodel to make an impact. Small upgrades like replacing outdated cabinet hardware, installing new light fixtures, or swapping in modern faucets can transform the look of these spaces.
In the kitchen, consider updating your backsplash with a clean, timeless tile or refreshing worn countertops with a durable surface. In bathrooms, re-grouting tile, caulking any cracks, replacing mirrors, or updating vanities are simple ways to modernize without overspending.
The Cost vs. Value report2 also found that the kitchen can be a smart place to invest in a minor remodel of surfaces and newer mid-priced appliances and fixtures. In the Seattle area, a minor remodel is estimated to recoup 118% of its cost when you sell.
Flooring Matters
Floors are often one of the first things buyers notice when touring a home. If your carpets are worn or stained, professional cleaning or even replacement can make a big difference. Hardwood floors are especially appealing and refinishing them is often more cost-effective than replacing them.
For areas where replacement makes the most sense, consider durable and stylish options like engineered wood or luxury vinyl plank. Consistent flooring throughout the main living areas can also help a home feel more spacious and cohesive.
Energy-Efficient Features
Today’s buyers are increasingly focused on efficiency and sustainability. Investments like LED lighting, programmable thermostats, and updated appliances not only lower utility bills but also signal to buyers that the home is modern and thoughtfully maintained.
If your budget allows, new windows or improved insulation can add value while appealing to environmentally conscious buyers. Highlighting these upgrades in your listing helps showcase both comfort and cost savings.
Decluttering and Staging
Sometimes the most impactful upgrade isn’t about new finishes, it’s about presentation. Decluttering each room, minimizing personal items, and rearranging furniture to optimize space can dramatically change how buyers perceive your home. Here’s a printable checklist to help. And the best part? It’s completely free.
Professional staging takes this one step further, creating a warm and welcoming atmosphere that helps buyers envision living in the space—it can also help your home sell faster and for more money according to a 2025 report3. Even small touches, like fresh flowers, cozy throws, and well-placed artwork, can make your home feel more stylish, comfortable, and truly move-in ready.
Making Smart Choices
The goal of any pre-sale investment is to spend strategically, choosing projects that increase appeal without overextending your budget. You can also refer to this article on what NOT to do.
As a Windermere agent, I’m an expert at helping sellers decide which upgrades matter most. From recommending paint colors to connecting you with trusted contractors, I’m here to make sure you get the best return on your investment. Through our Windermere Ready program, we can even front the cost of improvements like painting, landscaping, cleaning, and staging so your home shines its brightest when it hits the market. With concierge-level service and no payments due until closing, it’s a simple way to maximize your home’s value and sell faster.
Connect with me today to learn more about how I can help you prepare your home for the market with confidence:

Adapted from an article that originally appeared on the Windermere blog October 1, 2025.
1Copyright ©2025 “2025 Remodeling Impact Report.” NATIONAL ASSOCIATION OF REALTORS®. All rights reserved. April 9, 2025, https://www.nar.realtor/sites/default/files/2025-04/2025-remodeling-impact-report_04-09-2025.pdf.
2©2025 Zonda Media, a Delaware corporation. Complete data from the 2025 Cost vs. Value Report can be downloaded free at www.costvsvalue.com.
We earn the trust and loyalty of our brokers and clients by doing real estate exceptionally well. The leader in our market, we deliver client-focused service in an authentic, collaborative, and transparent manner and with the unmatched knowledge and expertise that comes from decades of experience.
© Copyright 2026, Windermere Real Estate/Mercer Island.
Football & Hockey Schedules, Recipes, & Tips

The big game is almost here…GO HAWKS!!! Kickoff is at 3:30 PM this Sunday, Feb. 8th on NBC and can also be streamed live via Peacock or NFL+. Scroll down for favorite gameday recipes and printable football bingo sheets. (There’s also a hockey version for Kraken fans!).
Need to brush up on your sports lingo? Check out Wikipedia’s handy football and hockey glossaries. You can say impressive things like, “Are they running a 3-4 defense?” and “It’s not icing unless the puck passes the goal line…”




We earn the trust and loyalty of our brokers and clients by doing real estate exceptionally well. The leader in our market, we deliver client-focused service in an authentic, collaborative, and transparent manner and with the unmatched knowledge and expertise that comes from decades of experience.
© Copyright 2026, Windermere Real Estate/Mercer Island.
How’s the Market? Year End Review of Seattle Area Real Estate in 2025

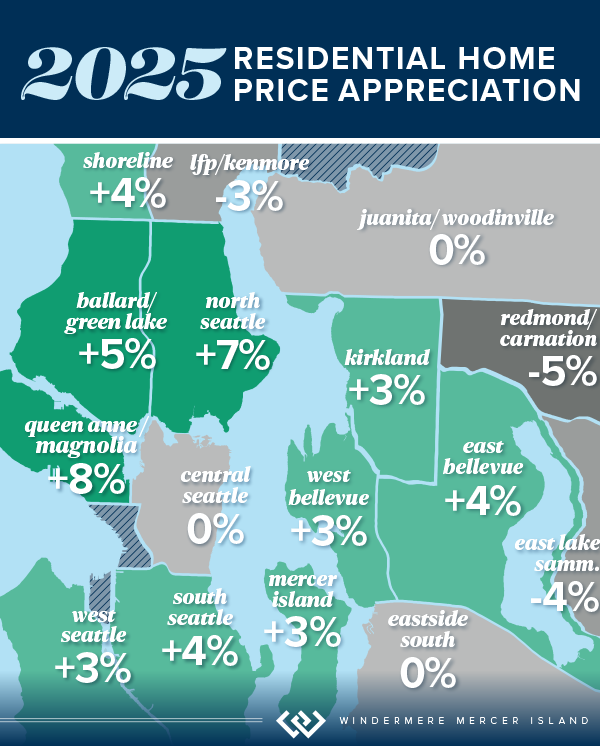
Home values held steady in 2025 with many communities seeing modest price gains. Seattle Metro’s median sale price and $ per sq. ft. both rose year-over-year, while the Eastside’s numbers remained similar to what we saw in 2024. Both areas saw double-digit spikes in the number of new listings and a slight slowdown in the number of sales.
Looking forward: this is a great year to invest! We’ve had a few back-to-back years of soft price gains, which feel like losses in our frequently HOT Seattle. This is as close to a “buyer’s advantage” market as we’ve seen in years. At the time of writing this, interest rates are available in the high 5’s. The cost of money is reasonable and the cost of property has not risen drastically in a few years. This is the perfect time to jump in for investors and first-time buyers. More specifically, anyone who can buy “unburdened” or without having to sell/carry two mortgages in order to buy. The condo and townhome markets continue to be a great opportunity for those looking to take the first step onto the property ladder. If none of this applies to you, remember: if you’re looking to buy and sell within the same market, you only get an advantage on one side.
Click or scroll down to find your area report:
Seattle | Eastside | Mercer Island | Condos | Waterfront
SEATTLE
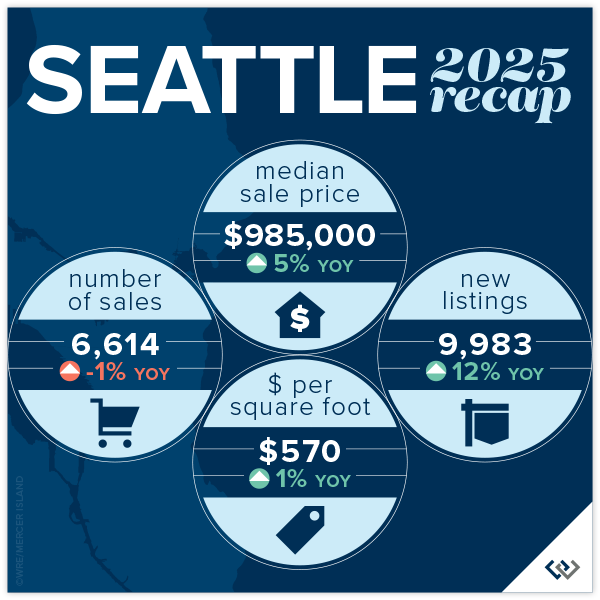
It’s all good news in the city of Seattle! The median price rose by 5% to $985,000. Pricing remained competitive, with 64% of homes selling at or above their list price (despite the fact that new listings increased 12% from 2024 and the number of sales dipped slightly).
Sales activity moved quickly in many neighborhoods. Citywide, 55% of homes sold within the first 10 days on market. Several areas posted strong performance, including Ballard & Green Lake with 1,705 homes sold, and North Seattle with 1,040 sales. Median prices varied by neighborhood, ranging from $794,000 in South Seattle to $1,399,000 in Queen Anne & Magnolia, reflecting the diversity of Seattle’s housing market.
Remember, these statistics include new construction data. In an inventory-constricted market, new construction data can skew pricing stats significantly. Check with your agent for how this affects your neighborhood.
Click here for the full report and neighborhood-by-neighborhood statistics!

EASTSIDE
Across the Greater Eastside, 5,458 homes sold during the year, down 5% compared to 2024. New inventory increased, with 8,259 new listings coming to market—up 16%! Fifty-five percent of homes sold at or above their list price, and 53% sold within the first 10 days on market, highlighting consistent transaction pace and buyer confidence across the region. Despite this, the median sale price held flat at $1,599,000 compared to 2024, while homes sold for an average of $688 per square foot, also similar to last year.
Several communities recorded notable activity levels, including Woodinville with 1,235 homes sold and East of Lake Sammamish with 1,134 sales. East Bellevue saw a 13% increase in homes sold, while Redmond posted a 15% increase in sales volume. Median sale prices varied by community, ranging from $1,281,000 in Woodinville to $3,688,000 in West Bellevue, reflecting the diversity of the Eastside housing market.
Several communities recorded notable activity levels, including Woodinville with 1,235 homes sold and East of Lake Sammamish with 1,134 sales. East Bellevue saw a 13% increase in homes sold, while Redmond posted a 15% increase in sales volume. Median sale prices varied by community, ranging from $1,281,000 in Woodinville to $3,688,000 in West Bellevue, reflecting the diversity of the Eastside housing market.

Click here for the full report and neighborhood-by-neighborhood statistics!
MERCER ISLAND
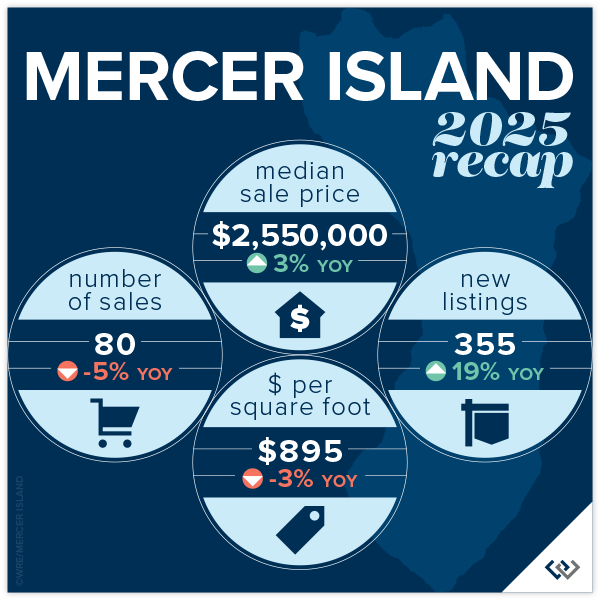
The 2025 Mercer Island real estate data reflects a year of steady activity and modest price gains. Median home prices rose 3% year over year to $2,550,000. Homes sold for an average of $895 per square foot, and half of all homes sold at or above their list price. Sales moved efficiently, with 56% of homes selling within the first 10 days on market.
A total of 80 single-family homes sold on Mercer Island during the year. Activity varied by neighborhood, with sales recorded across Northend, Southend, Mid-Island, First Hill, Westside, and The Lakes. Median home prices ranged from $1,775,000 in Mercerdale to $5,831,000 on the Westside, highlighting the range of housing options across the island.
Click here for the full report and neighborhood-by-neighborhood statistics!
CONDOS – SEATTLE & EASTSIDE
The 2025 Condo Report shows steady, encouraging activity across both the Seattle and Eastside condo markets. Year over year, condo sale prices increased a combined 2% to a median of $630,000, with homes selling for an average of $633/sq.ft. Half of all condos sold at or above their list price, signaling stable buyer demand. Inventory also expanded, with 8,331 new condo listings—up 14% from 2024! This is great news, increased supply that didn’t cause a price ‘dump’, it shows our Buyers may be returning to confidence around condos.
In Seattle, 2,695 condos sold during the year, a 9% increase in sales volume. The median Seattle condo price rose 2% to $585,000, and 51% of homes sold at or above list price. On the Eastside, 2,050 condos sold, with median prices increasing 5% year over year to $730,000. Eastside condos averaged $643 per square foot, with 51% selling at or above list price and 36% selling within the first 10 days. The market showed a combined 52 average days on market, with a 99% list to sales price ratio. Though, when original list to sales price ratio is compared the average sits at 97%. This means that patience and active calibration are both required when marketing your condo.
Mercer Island’s condo market also trucked along with 27 sales and a slight 1% year-over-year boost in median prices. Condos sold for an average of $591 per square foot, up 13% over 2024. Thirty-seven percent of condos sold at or above list price, and within the first 10 days. Inventory expanded as well, with 355 new condo listings, up 19% from 2024.
Check out area-by-area details in the full condo report.

WATERFRONT
Seattle saw a boost in the number of waterfront sales in 2025, with 36 compared to 31 in 2024. Lake Sammamish sales were similar to last year (31 vs. 30 in 2024), while Mercer Island and the Eastside both saw slight dips their sales numbers.
Mercer Island had the highest waterfront sale of the year at $25 million for a nearly 10,000 sq. ft. European Modern home on 102 feet of prime west-facing North End waterfront. The most modest sale was in Bellevue at $1.75 million for an original 1960s beach house on 50 feet of lakefront.
This brief overview of the entire Seattle-Eastside private waterfront market, including Mercer Island and Lake Sammamish, illustrates the trends occurring in our region over time. This data is interesting and insightful but cannot replace an in-depth waterfront analysis with your trusted professional.
View the full waterfront report

We earn the trust and loyalty of our brokers and clients by doing real estate exceptionally well. The leader in our market, we deliver client-focused service in an authentic, collaborative, and transparent manner and with the unmatched knowledge and expertise that comes from decades of experience.
© Copyright 2026, Windermere Real Estate/Mercer Island. Information and statistics derived from Northwest Multiple Listing Service and Trendgraphix, and deemed accurate but not guaranteed.
Housing Forecast: 6 Predictions for 2026

The following is a summary of Windermere Principal Economist Jeff Tucker’s six predictions for the U.S. housing market and economy in 2026. He goes into more detail about his predictions in the video below.
1. Existing Home Sales Will Pick Up (Barely)
Home sales have hovered near generational lows for three years. While a sharp rebound is unlikely, conditions point to a modest uptick in 2026. Inventory levels are higher than they’ve been since 2019, and mortgage rates are lower than they’ve been since 2022. Together, those factors should lift existing home sales—but not by much.
2. Home Prices Will Be Roughly Flat
Home prices are likely to remain flat in 2026, largely due to higher inventory putting downward pressure on values. The Case-Shiller Home Price Index showed small declines last summer, though that trend faded by fall. Sellers have been highly responsive to market shifts, often de-listing when offers fall short or holding off on listing altogether. That restraint has kept prices from falling further despite growing supply
3. Inventory Will Climb to Pre-Pandemic Levels
The number of homes for sale will likely return to pre-pandemic levels in 2026, possibly as early as spring. Inventory rose sharply in 2025, and a “shadow supply” of homes—those whose owners are waiting for better conditions—remains in the wings. Many “discretionary sellers” will continue testing the market, holding out for the right price. That behavior should extend average time on market and boost total listings, giving buyers more options and negotiating power.
4. The Homeownership Rate Will Decline
At current prices and interest rates, homeownership remains out of reach for many middle-class Americans who would have bought in different conditions. Slower rent growth has also reduced urgency among would-be buyers, encouraging them to stay put. More renters are opting for single-family homes to enjoy the space and lifestyle of ownership without a mortgage, a shift that will help push the overall homeownership rate slightly lower.
5. Mortgage Rates Will Decline Slightly
Mortgage rates should remain below 6.25% for most of 2026 and could briefly dip under 6%. The Fed’s rate cuts and slower growth have brought 10-year Treasury yields near 4%, while the spread between Treasuries and mortgage rates has narrowed toward its normal range of 2% or less. That trend is expected to continue as refinance risk on mortgage-backed securities gradually fades, but much of the improvement is already reflected in current rates, so significant declines are unlikely.
6. We Will Avoid a Recession in 2026
The U.S. economy weathered several shocks in 2025 but avoided a downturn. Payroll gains have slowed, though more due to shrinking labor supply than weak demand, and unemployment claims have remained stable. After early trade policy turbulence, corporate earnings rebounded strongly, and tariff concerns have faded as court challenges and new trade deals rolled back some of the costliest restrictions.
This article originally appeared on the Windermere blog December 2, 2025.
We earn the trust and loyalty of our brokers and clients by doing real estate exceptionally well. The leader in our market, we deliver client-focused service in an authentic, collaborative, and transparent manner and with the unmatched knowledge and expertise that comes from decades of experience.
© Copyright 2025, Windermere Real Estate/Mercer Island.


